This repository aims to give the reader a brief introduction to vector network analyzers, for someone who has never come across one before, or someone who is tasked with using a vector network analyzer, but knows nothing about them.
What is VNA?
A vector network analyzer, often known by the acronym VNA is an essential piece of test equipment that no RF engineer should be without.
If you have previously worked with Electronics at low frequencies, you may consider a good DMM or oscilloscope your best friend. RF engineers would gladly trade both for a good VNA!
A good VNA is an expensive bit of kit. Many years ago, a good one would probably cost you as much as a fairly nice house. Nowadays, you can pickup something really good for the price of a nice car.
Note: High-end VNAs can still sell for between $100k and $1M, for that I will use term ‘professional VNA’.
Luckily, there are cheap alternatives now, such as the NanoVNA. It doesn’t hold a candle to the performance of a professional piece of kit, but for the price, and used with care, it’s not too bad.
VNA is a piece of electronic test equipment, usually used for characterising radio frequency (RF) and microwave networks.
The leading manufacturers of VNAs are Keysight, Rohde & Schwarz and Anritsu.
Form factors of vector network analyzers
Typically the lowest frequency of instruments is a few hundred kHz, and the upper-frequency many GHz, although instruments are available which work down to a few Hz, as well as up to more than 1 THz. Usually instrument designed for very high frequencies do not work to very low frequencies, and instruments designed to work for very low frequencies do not work at very high frequencies. We are unaware of any instrument that covers from 5 Hz to 1 THz.
Historically VNAs were large instruments with a display, some controls on the front panel, and were powered by mains electricity. All internal calculations were performed with one or more CPUs. A particularly popular series of instruments was the HP/Agilent 8753 series. There were probably more 8753s made than any other series of VNAs.
The 8753s are obsolete, but still regularly used in a lot of companies.
More recently many VNAs have become available that have no display at all but are designed to be connected to a Windows computer, with the processing and display performed by the computer. This results in lower cost. Copper Mountain is one of the best-known manufacturers of such instruments.
There is also a range of fully self contained portable VNAs. The Keysight FieldFox range is the most comprehensive of this type.
What does it do?
A VNA is designed to inject a source signal of known frequency and amplitude into an RF port and measure the relative amplitude and phase of this signal when received at a number at one, or more of it’s ports.
That sounds pretty complex, but it’s really not. An analogy may help.
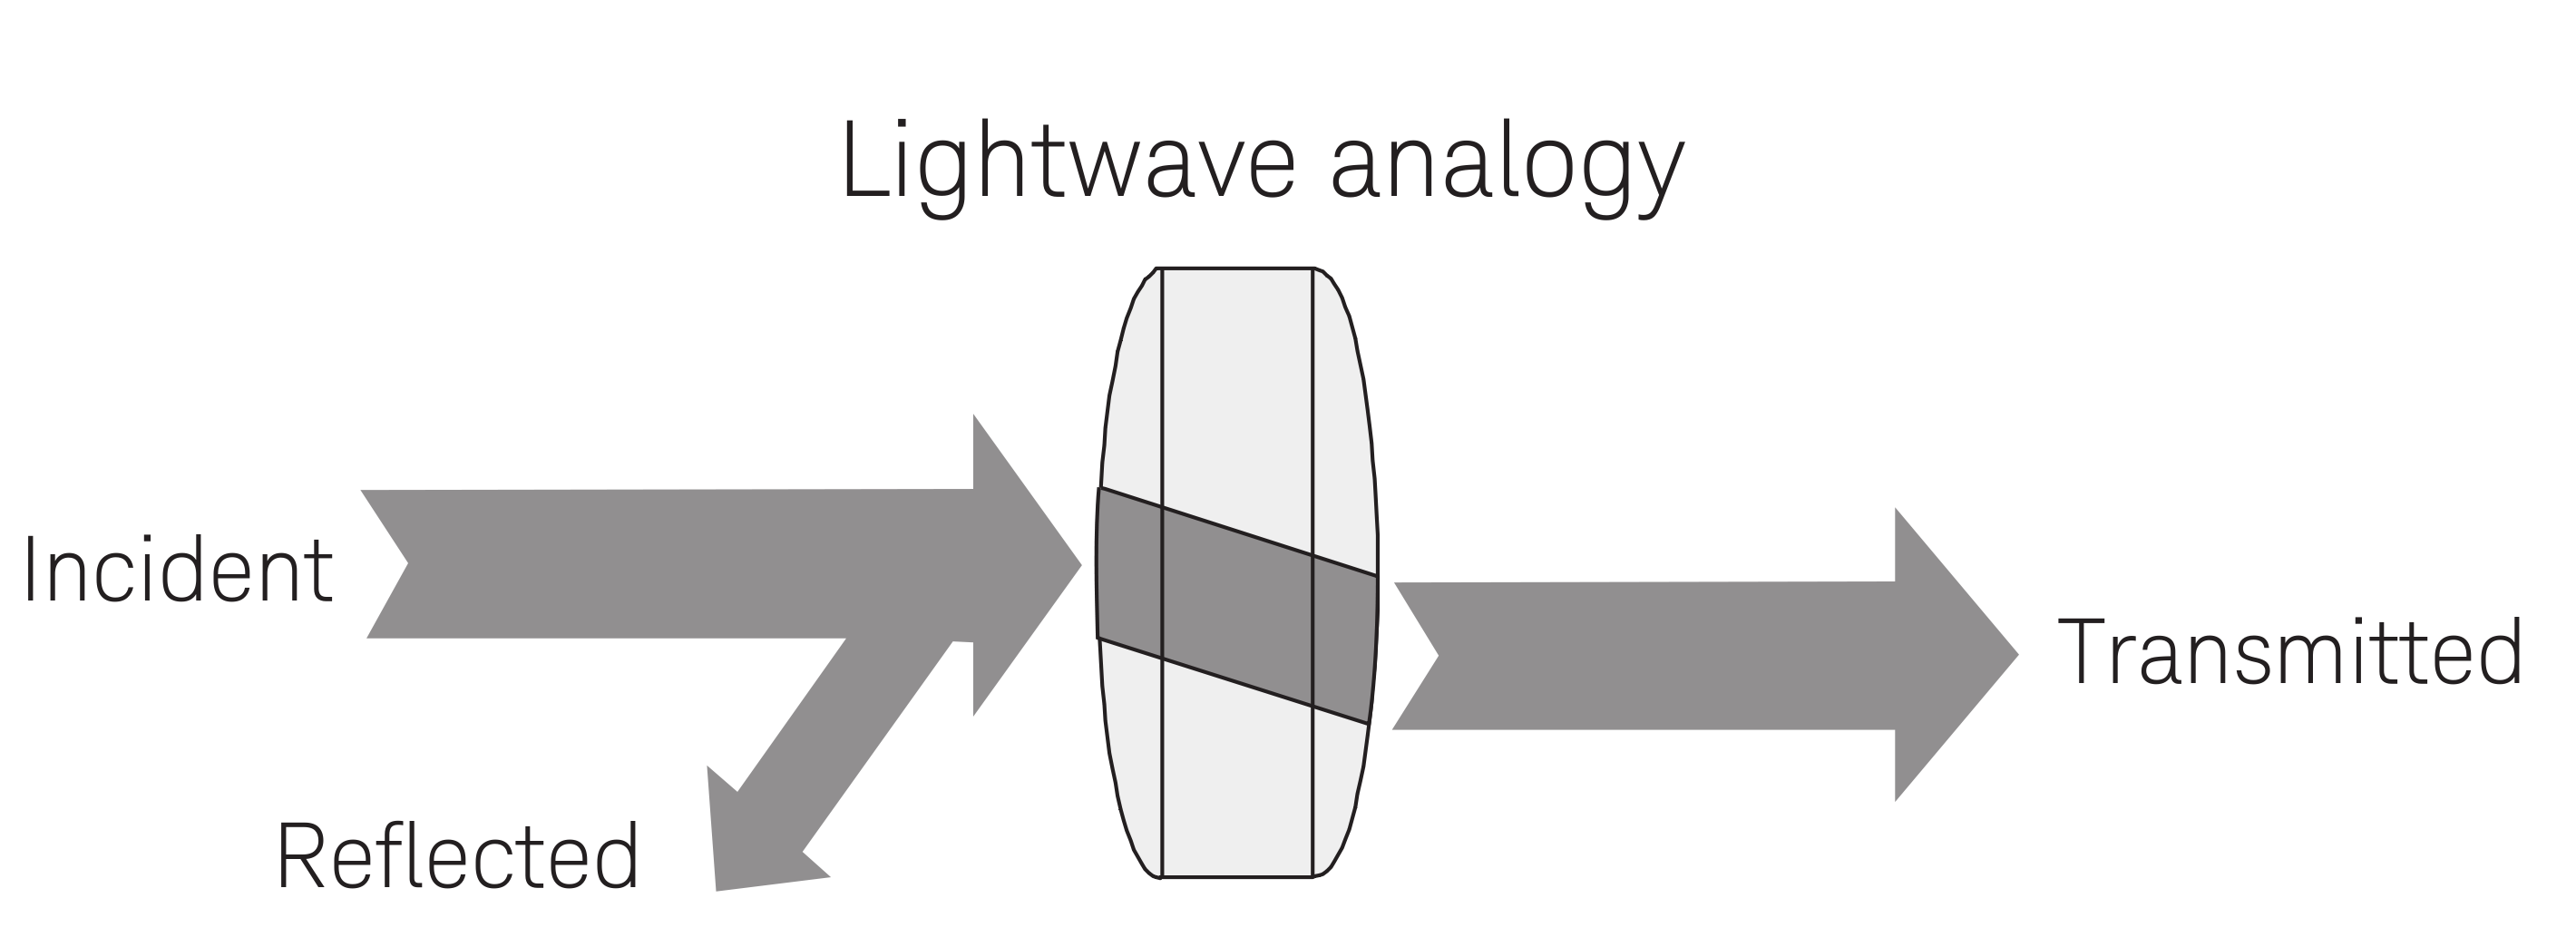
A lightwave analogy of a device that would be measrued with a VNA

In the above diagram, light is seen to be incident on a lens. Some light is transmitted through the lens, and some is reflected from the lens. If you wanted to make a simple very instrument to characterise the lens you could have it consisting of just three parts.
- A source of light - e.g. an LED.
- A detector of light to detect the transmitted light - e.g. a photodiode.
- A detector of light to detect the reflected light - e.g. a photodiode.
The above is a scalar instrument - it detects the magnitude of the light, but not its phase.
Many RF devices behave similar to the lens, in that some of the incident RF signal is reflected, and some is transmitted. A simple scalar network analyzer would need to consist of
- A source of RF energy.
- A power meter, able to measure the intensity of the transmitted signal.
- A power meter, able to measure the intensity of the reflected signal.
A vector network analyzer is similar to the scalar vector analyser, but the VNA has one major difference - it can detect both the magnitude, and the phase of the signals.

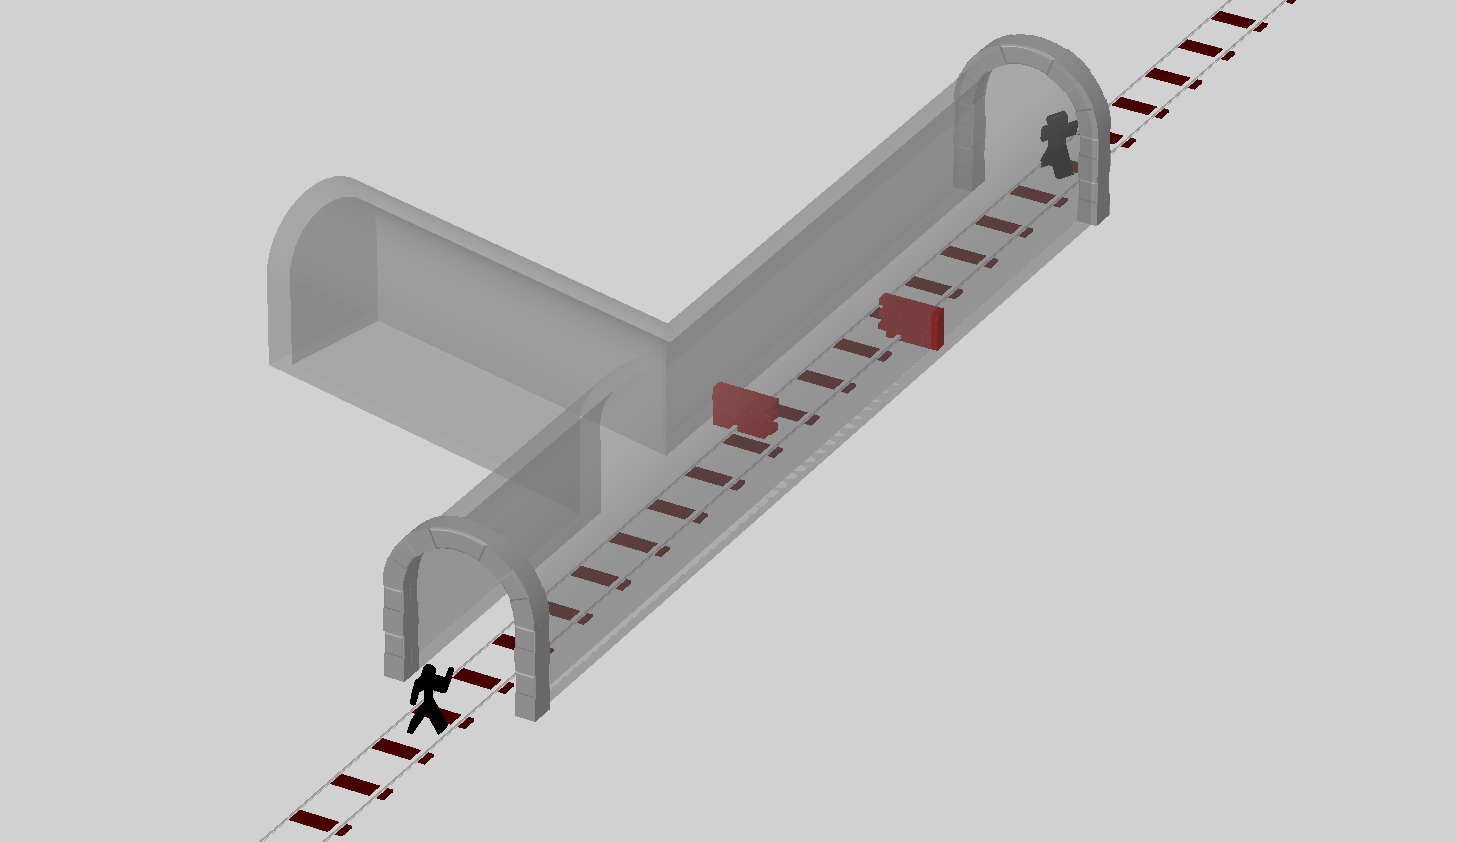
What happens if I shout into the tunnel and have a friend listen at the other end. We might be able to work out the length from the volume and delay (you were careful to synchronise watches) of the received sound. Perhaps, we can detect a difference between the high and low pitch sounds. Maybe there is some material in there that is absorbing the high pitch noises, or closed service tunnel that has created a resonance. You have just measured the ‘thru’ characteristics of this tunnel. In VNA parlance, we will call this a S21 measurement, meaning we have made a measurement of a signal at port 2(your friend) of a signal injected at port 1(your beautiful voice).
Now, you do the same, but this time listen to the echo of your shout reflect back to you. Perhaps there is a blockage, somewhere in the tunnel that is reflecting your voice. If hear the echo, back at the same volume, you might reasonably that none of the sound could have reached the other end. Congratulations, you have just measured the reflection of the tunnel. Using the same nomenclature as before, we can call this S11. i.e a measurement of what you heard at port 1, when you shouted into port 1.
We can now start to make this as complex as we wish. Imagine a tunnel network with many entrances. We can get a group of friends to stand at each entrance and take it in turns to shout and listen. We will number each entrance from 1 to n and record details of what was heard at each entrance, again using the nomenclature we used before. So, for example, we may have measurement of S32 to indicate that this is a measurement of what we heard at entrance 3 while someone yelled into entrance 2.
The whole set of all possible combinations of shouting and listening at each entrance is what we call the S-Parameters of the tunnel.
Now, the astute, might have noticed that I casually dropped in the word relative before. This is important, to accurately map our tunnels, we need to know the exact details of what we yelled into the the entrances. When we do this with our VNA, instead of randomly bellowing into the tunnel, lets just sing a single note and compare the amplitude and time of the received signal. With just a single tone, we can’t accurately measure the time(with only a single frequency measurement), but we can record the phase difference. We can now repeat this for every frequency we are interested in.
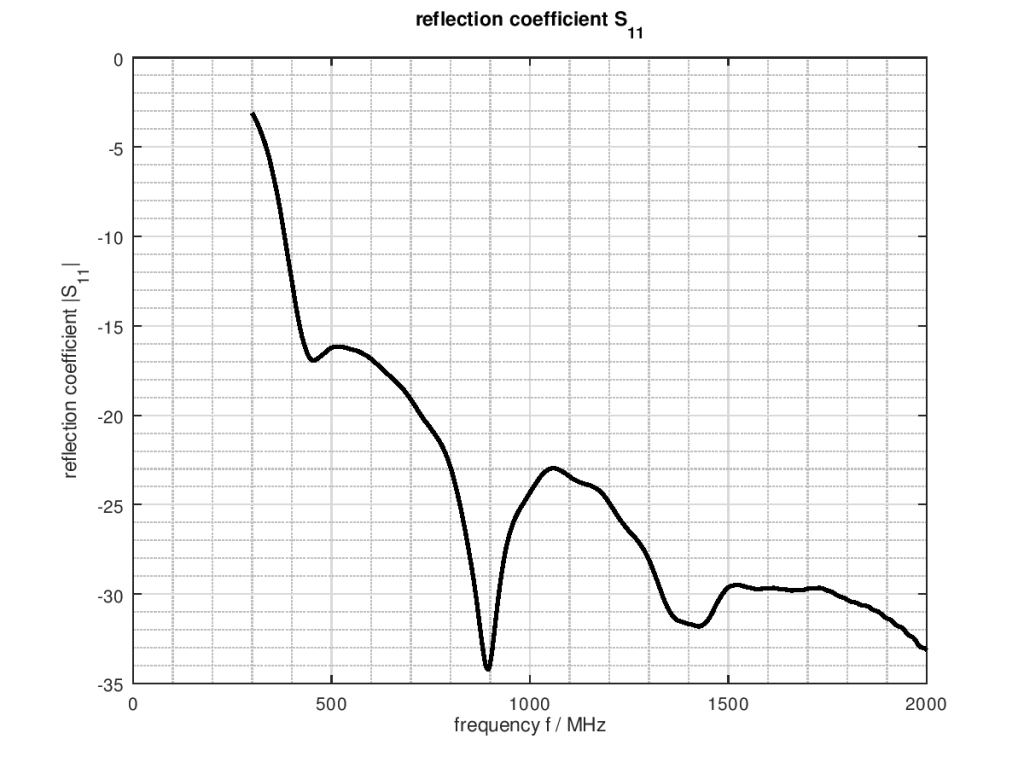
There are a number of ways to plot this data. The most basic being just a rectangular plot of frequency on the X axis and Amplitude on the Y. Commonly we will scale the Y axis to be a logarithmic(normally dB) scale.

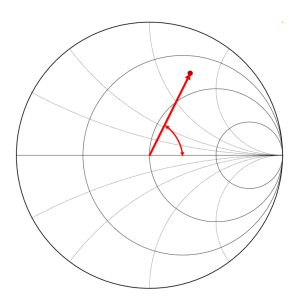
The next most common is the Smith Chart.

This looks complex, but ignore the funny lines for now. This is just a polar plot with our received signal plotted as an amplitude and phase. The outside circle represents a situation where we have received a signal of equal amplitude to the transmitted signal. The centre of the plot shows where the received signal is near zero.
Both plots shown are useful. The rectangular plot is makes it very easy to see how a network performs at different frequencies. The smith chart is very useful for impedance matching, but is not needed for many simpler use cases.